Research · Mott Haven Renter Index
The Mott Haven Renter Index
An original, sourced read on the South Bronx's new-construction rental market: what it costs, how fast it is growing, and how it compares to the neighborhoods around it.
Updated June 14, 2026
What this study found
Three findings define the Mott Haven new-construction rental market in 2026, each drawn from public data.
- Mott Haven's new-construction median asking rent was about $3,050 a month in 2024, roughly 2.7 percent above the Bronx-wide median of $2,696 and well below Manhattan, where the borough median asking rent reached $4,730 in early 2026.1
- Mott Haven/Melrose remains a tight, heavily renting market: the rental vacancy rate was 1.8 percent in 2024 and the area's real median gross rent across all housing was about $1,170, far below new-construction asking rents, a gap that defines the neighborhood.2
- New supply is arriving steadily: New York City issued new certificates of occupancy to 566 residential units in new Mott Haven/Melrose buildings in 2025, adding to a multi-year pipeline that is reshaping the waterfront and the Piano District.2
About this index
What the Renter Index measures, and why
The Mott Haven Renter Index is an original analysis of one neighborhood's rental market, built entirely from public data. It exists because Mott Haven is changing faster than the data most renters see: a wave of new construction has arrived in a place whose published rent statistics still reflect an older, lower-cost housing stock. The result is a market with two very different price layers in the same square mile.
This report compiles the figures that matter for understanding that market: what new buildings ask, how much new housing is being delivered, how the area's broader rent and vacancy numbers compare, and how Mott Haven sits against nearby submarkets. Every number below is sourced to a public dataset or report and linked. Where a figure could not be verified from a public source, it was left out rather than estimated.
Rents
What new construction asks in Mott Haven
By the numbers
Mott Haven rents in context, 2024 to 2026
| Indicator | Figure | Source and date |
|---|---|---|
| Mott Haven new-construction median asking rent | About $3,050 a month | BrickUnderground, 2024 |
| Bronx median asking rent (same period) | $2,696 a month | BrickUnderground, 2024 |
| Mott Haven/Melrose real median gross rent (all housing) | About $1,170 a month | NYU Furman Center, 2024 |
| Bronx borough median asking rent | Above $3,100 a month | StreetEasy via BrickUnderground, early 2026 |
| Manhattan borough median asking rent (benchmark) | $4,730 a month | StreetEasy via BrickUnderground, early 2026 |
Primary sources: NYU Furman Center, BrickUnderground, and StreetEasy (see the full list below).
Supply
How much new housing Mott Haven is delivering
Supply at a glance
- 566
- new residential units received certificates of occupancy in Mott Haven/Melrose in 2025.NYU Furman Center, 2025
- 1.8%
- rental vacancy rate in Mott Haven/Melrose in 2024, a notably tight market.NYU Furman Center, 2024
- 6.1%
- homeownership rate in Mott Haven/Melrose in 2024, against 32.7 percent citywide, an overwhelmingly renting neighborhood.NYU Furman Center, 2024
In context
How Mott Haven compares to nearby submarkets
Mott Haven's appeal in the current market is relative value. As Manhattan and Brooklyn set records, demand cascades outward to neighborhoods that were historically the lower-cost alternative, and those neighborhoods price up in turn. Mott Haven sits at the leading edge of that cascade: close enough to Manhattan for a sub-30-minute commute, but priced a full tier below the boroughs across the river.
Against three reference points, the gap is concrete. A new-construction budget that rents a full two-bedroom in Mott Haven generally clears only a studio or a smaller older one-bedroom in Williamsburg or Long Island City, where one-bedroom averages ran well above the new Mott Haven two-bedroom asking rents in 2026. The trade is space and price against the established nightlife and shorter rides of those Queens and Brooklyn submarkets.
Side by side
Mott Haven against nearby submarkets, 2026
| What you compare | Mott Haven | Williamsburg | Long Island City |
|---|---|---|---|
| What a new-construction budget rents | A full new two-bedroom | A studio or smaller one-bedroom | A studio or smaller one-bedroom |
| Typical one-bedroom rent, 2026 | Neighborhood median asking rent about $3,050 | One-bedroom average about $4,850 | One-bedroom average about $4,436 |
| Commute to Midtown | 6 train, about 25 minutes | L and G trains, roughly 25 to 35 minutes | 7 and E trains, roughly 15 to 20 minutes |
Sources: BrickUnderground, RentHop, and RentCafe 2026 rent reports (see the full list below).
What is driving the market
Why Mott Haven is moving
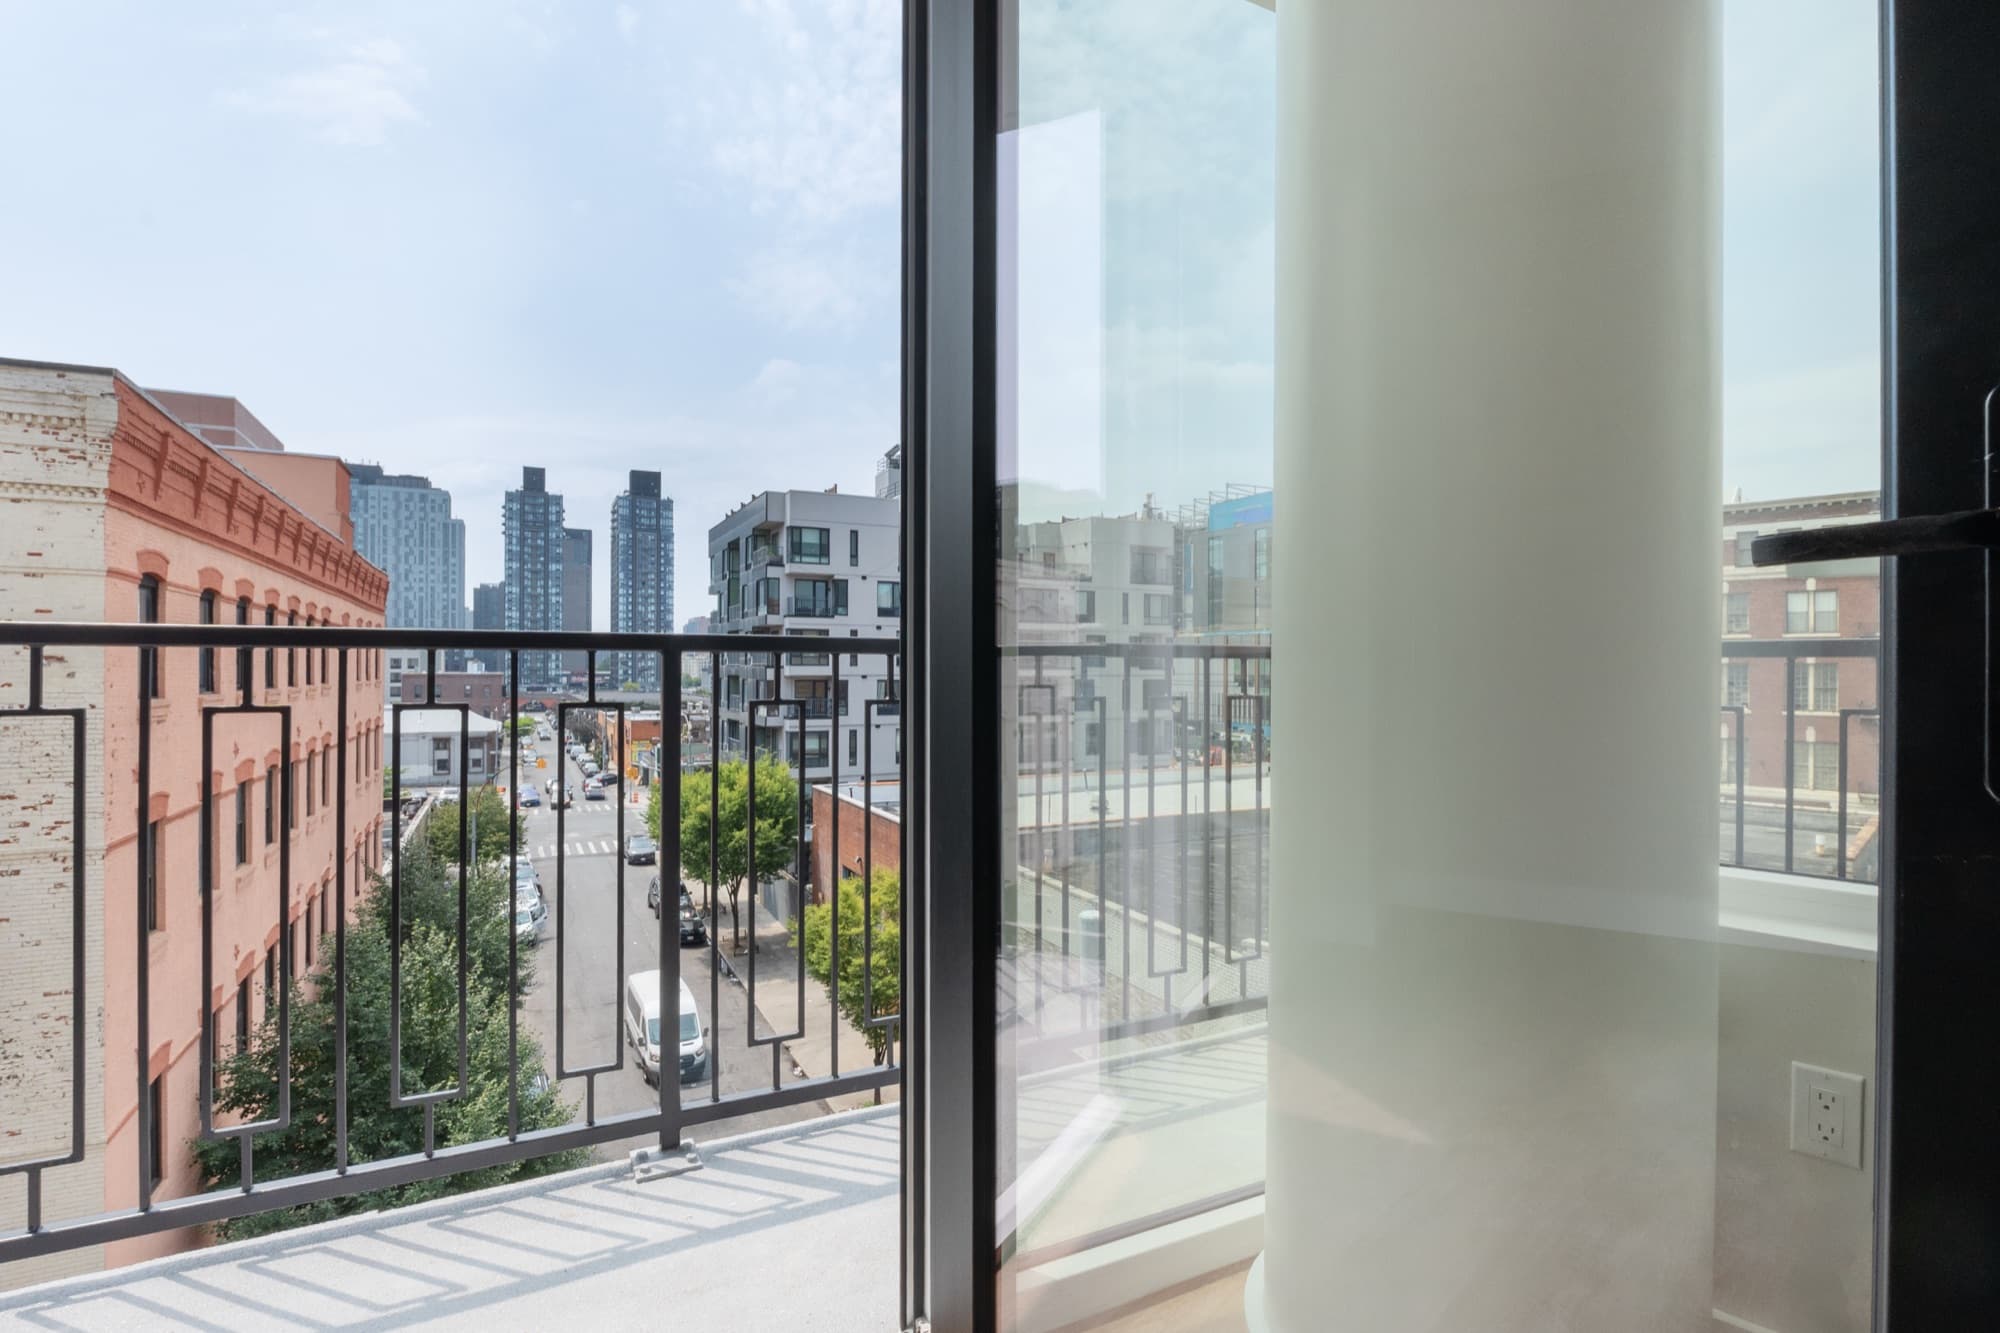
The third is new supply itself. A decade of rezoning and development along the Harlem River waterfront and the Bruckner corridor has turned former industrial blocks into a corridor of new rental buildings, the area sometimes marketed as the Piano District. That construction is what makes a modern doorman two-bedroom available in Mott Haven at all; without it, the neighborhood's published rent and vacancy figures would describe a market with almost no new inventory to rent.
Methodology
How this index was built
This report compiles published figures from public sources. It does not scrape listing sites, use any paid data feed, or estimate values that a source did not state. Every figure is reproduced as its source reported it, with the source and date noted. The notes below explain what each figure means and the limits of the data.
- Sources used
- Area housing indicators (median gross rent, rental vacancy, homeownership rate, new units certified) come from the NYU Furman Center's neighborhood profile for Mott Haven/Melrose, which draws on the U.S. Census American Community Survey and New York City administrative data. New-construction asking rents and the borough and citywide rent benchmarks come from published 2024 to 2026 market reports by BrickUnderground and StreetEasy. Nearby-submarket rent figures come from RentHop and RentCafe 2026 rent research. Transit facts come from the MTA and public station records.
- Geography and dates
- Two geographies appear in this report and are kept distinct. Area indicators describe Mott Haven/Melrose, the Bronx Community District 1 statistical area the Furman Center reports on, and carry the year the source assigned. New-construction asking rents describe recently completed market-rate buildings in the Mott Haven section specifically and reflect 2024 to 2026 listing data. The two are not the same measure: area median gross rent reflects all existing housing, including older and regulated units, while new-construction asking rent reflects only the newest market-rate inventory. The large gap between them is a real feature of the neighborhood, not a data error.
- Limitations
- Asking rent is advertised rent, not rent paid, and figures that are net effective fold in free-month concessions; both are noted where a source flagged them. Market reports differ in method and timing, so figures from different sources are not perfectly comparable and are presented as each source reported them. This index covers aggregate market and housing-stock data only. It makes no claim about any individual building's full inventory beyond the single sourced data point cited for context, and it draws no inference about who lives in the neighborhood.
- Updates and review
- The Renter Index is dated and will be revised as new public data is released. Before public publication this report is to receive a methodology review by counsel and to carry the named bylines of its authors; until then it is published as a methodology-complete working analysis with every figure sourced.
Sources
- Why NYC renters may be surprised by Mott Haven's new developments, BrickUnderground (new-construction median asking rent and unit sizes)
- Mott Haven/Melrose neighborhood profile, NYU Furman Center (median gross rent, rental vacancy, homeownership rate, units certified)
- Manhattan and Brooklyn rents hit all-time highs, BrickUnderground and StreetEasy (borough and citywide median asking rent benchmarks)
- Average rent in Williamsburg, RentHop (2026 one- and two-bedroom averages)
- Average rent in Long Island City, RentCafe (2026 one-bedroom averages)
- Third Avenue-138th Street station, public MTA and station records (6 train service)
Plan a visit
See the Mott Haven market for yourself.
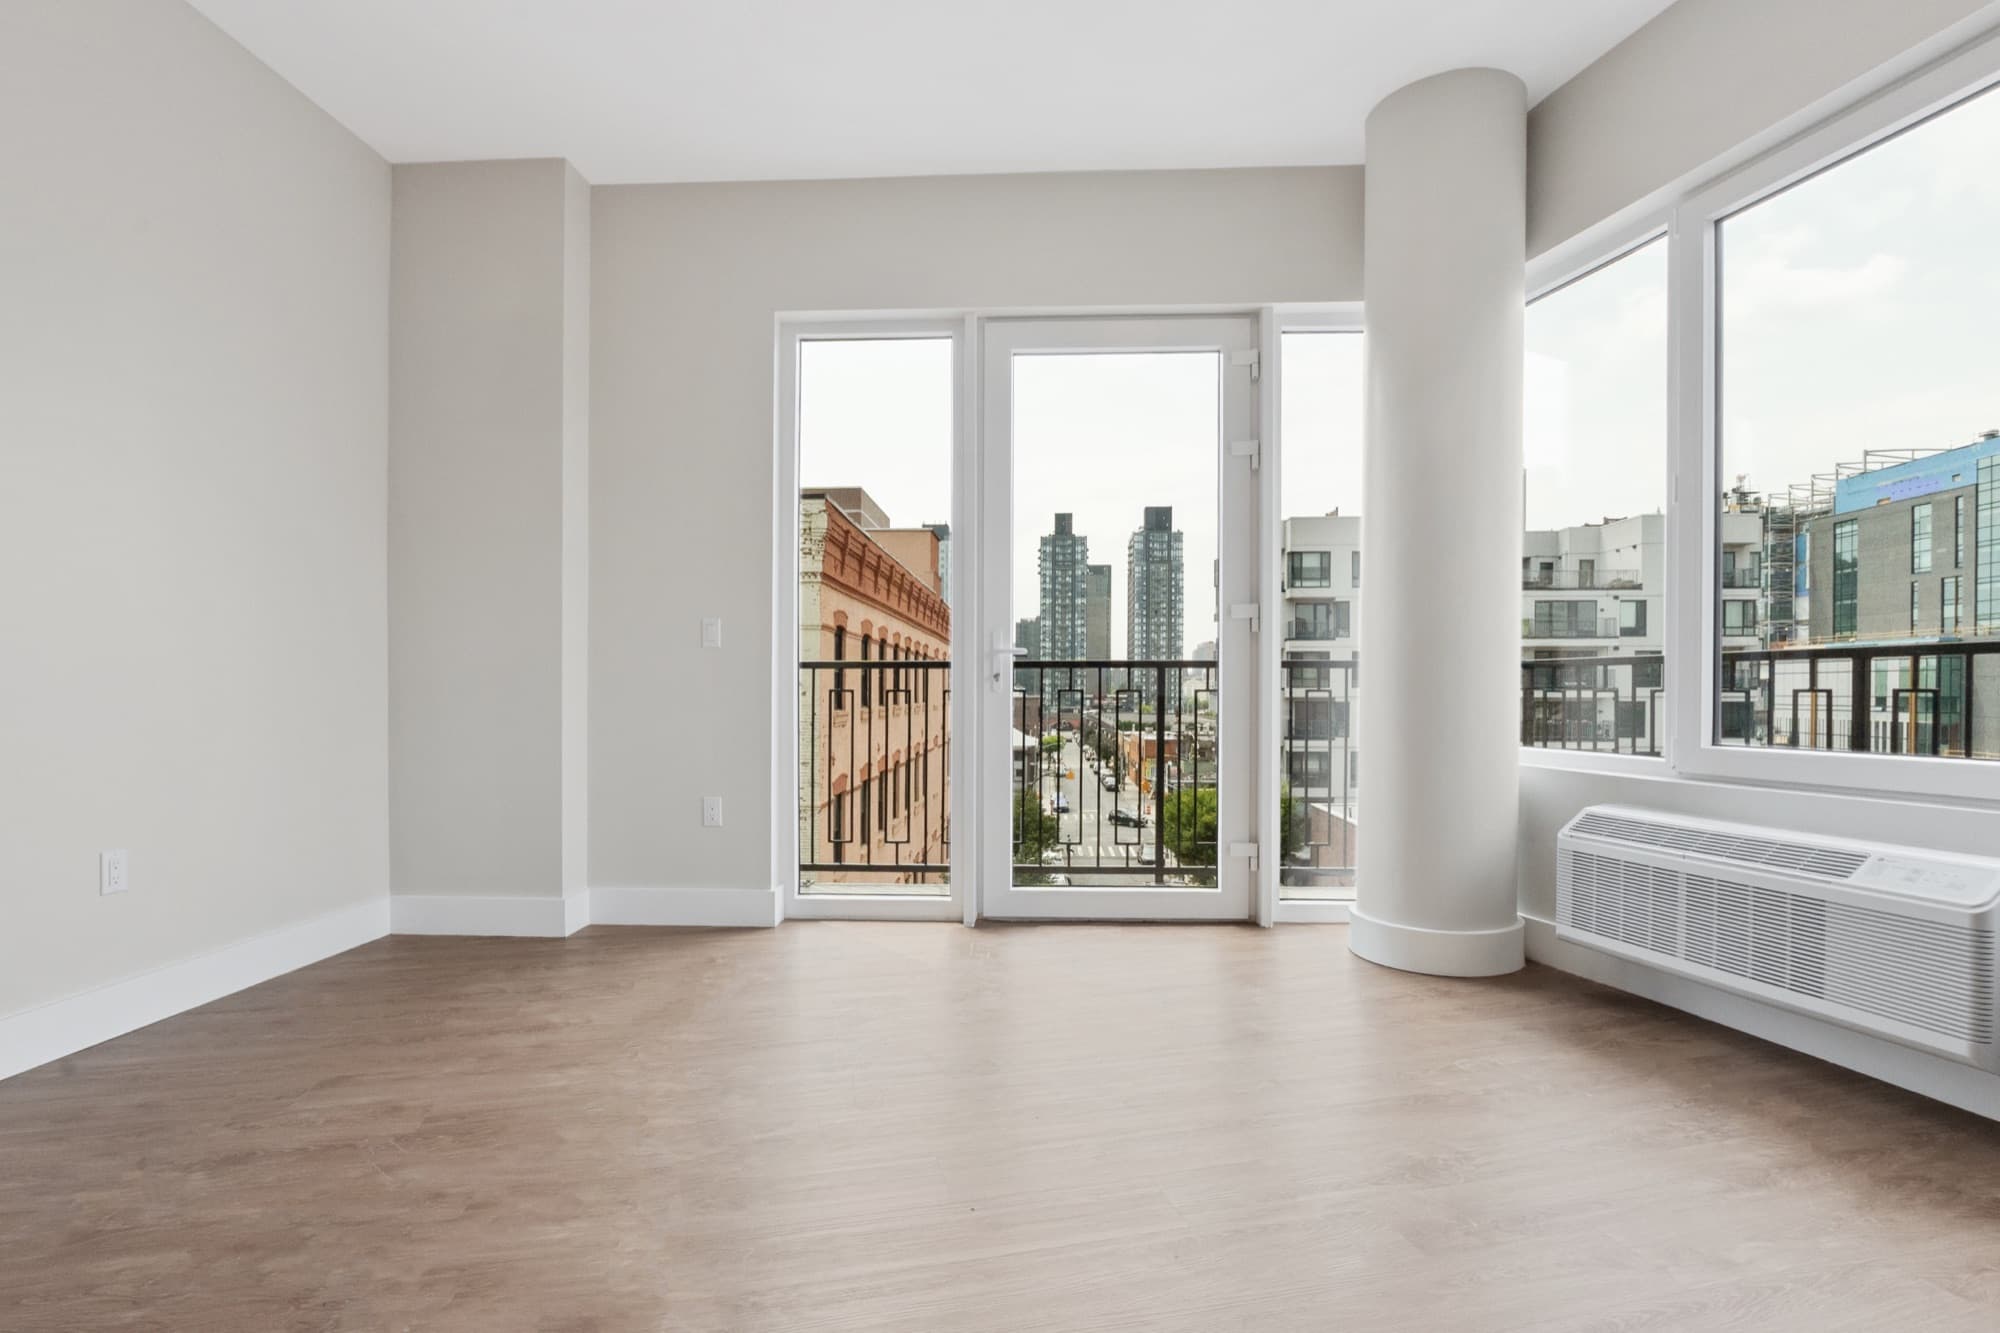
The numbers describe a neighborhood at the front of the city's value shift. Come walk a new two-bedroom and see what the index means in person.